


Sonic Pipe Inspection - Detailed Reporting
Upon completion of the onsite data collection, the information is uploaded to Sonic Pipe Inspection's proprietary software and compiled into a comprehensive easy to read report, allowing you to make informed decisions regarding your fire sprinkler system.
Sonic's report consists of 5 main sections: Executive Summary, explanation of Sonic Pipe Inspection's technology, color coded graphical representation of the findings, all hard data in a table format, and finally, a full page for each reading showing all data collected, it's ratio to that of pristine pipe, and copies of the actual signal waveform.

Our reports begin with a general overview of that particular project, providing a quick point or reference defining the area scanned, types and number of scans conducted, description of any issues that had arisen, and a matrix listing the areas of concern.

This section provides the reader with the basis of how the technology works, along with a quick overview of how we interpret the waveforms, what the acronyms mean, what all the numbers represent, and how we color code each of the inspection points.

To provide a quick visual representation of the data, Sonic Pipe Inspection color codes each scan point as described in the EXPLANATION of TECHNOLOGY section, and then maps out those color coded points as they were collected in the field. Sonic will either overlay the scan points on to a soft copy of fire sprinkler system architectural drawing (when available) or mock up a general visual of the system when no soft copy is available.
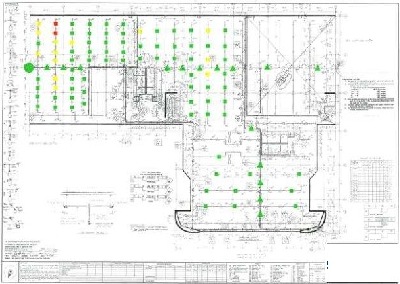 Each individual color coded scan point is positioned
in its approximate location on the "map" with its unique identifier.
This identifier corresponds with the same identification number written
on the pipe as the technician is collecting the raw data, allowing you
to pinpoint the exact physical location associated with every color
coded point on the "map".
Each individual color coded scan point is positioned
in its approximate location on the "map" with its unique identifier.
This identifier corresponds with the same identification number written
on the pipe as the technician is collecting the raw data, allowing you
to pinpoint the exact physical location associated with every color
coded point on the "map".

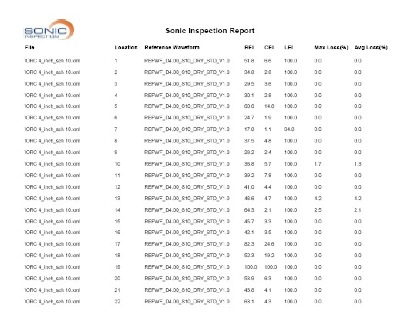
If a quick reference to more data is required, Sonic compiles all of the raw data into a table format for each zone scanned. This provides a quick reference to the numerical data, with information such as the REI, CEI, and LEI degradation percentages, as well as maximum and average wall loss at scan points where thickness measurements are taken. Each scan point is represented on one line of the table, with its corresponding identification number.

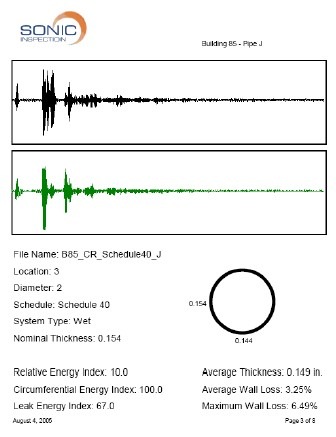
The final section of Sonic pipe Inspection's report is the RAW DATA. This is the largest portion of the report, with one full page dedicated to each scan point. If 1,000 scan points are taken, there will be 1,000 pages of raw data in addition to the information provided in the other four sections of the report. Each page consists of:
- A graphical representation of the baseline waveform for a pristine pipe
- A graphical representation of the actual waveform captured in the field
- The unique identifier for that particular scan point
- The diameter, schedule, wet or dry system type, and nominal thickness of the pipe at that particular point
- The Relative, Circumferential, and Leak Energy indexes
- When applicable, a graphical representation of thickness checks with the average thickness measured, average wall loss, and maximum wall loss at that scan point
The combination of all of this data provides a comprehensive "snapshot" of the fire sprinkler system pipe at the time the data was collected. You will know exactly which portions of your system are good and where there are areas of concern that require further attention.
At this point, you bring in your fire sprinkler service contractor and take the necessary steps to bring your system back to a safe and reliable state of condition, without unnecessarily replacing good pipe or setting your business up for catastrophe by continuing to use unsafe materials.